Your web application’s log data contains a vast amount of actionable information, but it’s only useful if you can cross-reference it with other events in your system. For example, CloudTrail provides an audit trail of everything that’s happened in your AWS environment. This makes it an indispensable security tool—but only if you can correlate CloudTrail activity with changes in web traffic, spikes in error log messages, increased response times, or the number of active EC2 instances.
In this article, we’ll introduce the basics of AWS log analytics. We’ll learn how a centralized log manager gives you complete visibility into your full AWS stack. This visibility dramatically reduces the time and effort required to troubleshoot a complex cloud application. Instead of wasting developer time tracking down software bugs in all the wrong places, you can identify issues quickly and reliably by replaying every event that occurred in your system leading up to a breakage.
As you read through this article, keep in mind that troubleshooting with a centralized log management tool like Sumo Logic is fundamentally different than traditional debugging. Instead of logging into individual machines and grep’ing log files, you identify root causes by querying all of your log data from a single interface. A powerful query language makes it easy to perform complex lookups, visualizations help you quickly identify trends, and its centralized nature lets you cross-reference logs from different parts of your stack.
Scenario
This article assumes that you’re running an Apache web server on an EC2 instance, storing user photos in S3 buckets, and using CloudTrail to monitor your AWS administration activity. We’ll be walking through an example troubleshooting scenario to learn how AWS log data can help you identify problems faster than traditional debugging techniques.
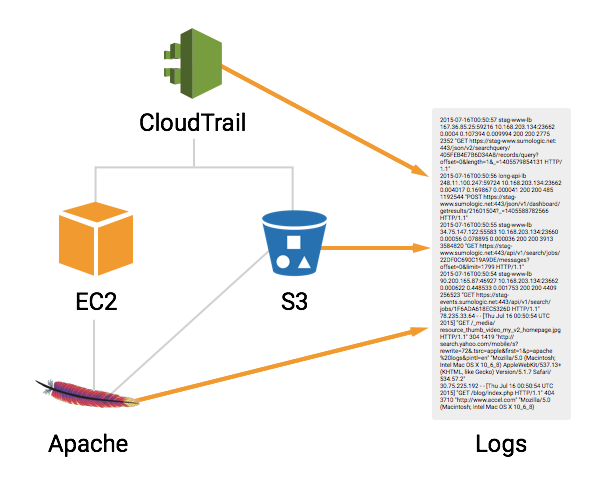
After a recent code push, you start receiving complaints from existing users saying that they can’t upload new images. This is mission-critical functionality, and fixing it is a high priority. But where do you start? The breakage could be in your custom application code, Apache, the EC2 instance, an S3 bucket, or even third-party libraries that you’re using.
Traditional debugging would involve SSH’ing into individual machines and grep’ing their log files for common errors. This might work when you only have one or two machines, but the whole point of switching to AWS is to make your web application scalable. Imagine having a dozen EC2 instances that are all communicating with a handful of S3 buckets, and you can see how this kind of troubleshooting could quickly become a bottleneck. If you want a scalable web application, you also need scalable troubleshooting techniques.
Centralized logging helps manage the complexity associated with large cloud-based applications. It lets you perform sophisticated queries with SQL-like syntax and visualize trends with intuitive charts. But, more importantly, it lets you examine all of your log data. This helps you find correlations between different components of your web stack. As we’ll see in this article, the ability to cross-reference logs from different sources makes it easy to find problems that are virtually impossible to see when examining individual components.
Check the Error Logs
As in traditional debugging, the first step when something goes wrong is to check your error logs. With centralized logging, you can check error logs from Apache, EC2, S3, and CloudTrail with a single query:
error <code class="o">|</code> <code class="k">summarize</code>
Running this in Sumo Logic will return all of the logs that contain the keyword error. However, even smaller web applications will output millions of log messages a month, which means you need a way to cut through the noise. This is exactly what the summarize operator was designed to do. It uses fuzzy logic to group similar messages, making it much easier to inspect your log data.
In our example scenario, we only see minor warnings—nothing that indicates a serious issue related to user accounts. So, we have to continue our analysis elsewhere. Even so, this is usually a good jumping-off point for investigating problems with your web application.
Check for Status Code Errors
Web application problems can also be recorded as 400- and 500-level status codes in your Apache or S3 access logs. As with error logs, the advantage of centralized logging is that it lets you examine access logs from multiple Apache servers and S3 buckets simultaneously.
_sourceCategory=S3/AccessOR_sourceCategory=Apache/Access|parse"HTTP/1.1\" * "asstatus_code|wherestatus_code>400|timeslice1m|count bystatus_code,_timeslice|transpose row_timeslicecolumnstatus_code
The _sourceCategory metadata field limits results to either S3 logs or Apache access logs, the parse operator pulls out the status code from each log, and the where statement shows us only messages with status code errors.
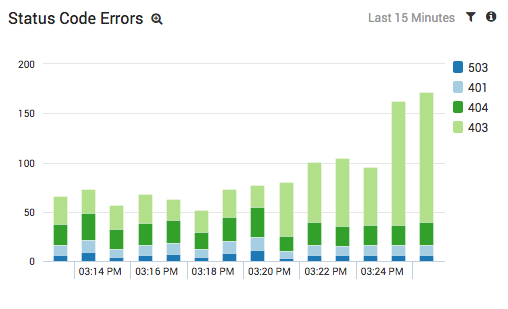
The results from our example scenario are shown above. The light green portion of the stacked column chart tells us that we’re getting an abnormal amount of 403 errors from S3. We also noticed that the errors come from different S3 buckets, so we also know that it isn’t a configuration issue with a single bucket.
Dig Deeper Into the S3 Logs
Our next step is to take a closer look at these 403 errors to see if they contain any more clues as to what’s wrong with our web application. The following query extracts all of the 403 errors from S3:
<pre><code class="nf">_sourceCategory</code><code class="o">=</code>S3/Access<code class="o">|</code> <code class="k">parse </code><code class="s">"HTTP/1.1\" * "</code> <code class="k">as </code>status_code<code class="o">|</code> <code class="k">where </code>status_code <code class="o">=</code> 403</pre>
If we look closely at the raw messages from the above query, we’ll find that they all contain an InvalidAccessKeyID error:

This tells us that whatever code is trying to send or fetch data from S3 is not authenticating correctly. We’ve now identified the type of error behind our broken signup functionality. In a traditional debugging scenario, you might start digging into your source code at this point. Examining how your code assigns AWS credentials to users when they start a new session would be a good starting point, given the nature of the error.
However, jumping into your source code this early in the troubleshooting process would be a mistake. The whole point of log analytics is that you can use your log data to identify root causes much faster than sifting through your source code. There’s still a lot more information we can find in our log messages that will save several hours of troubleshooting work.
Identify the Time Frame with Outlier
This InvalidAccessKeyID error wasn’t there forever, and figuring out when it started is an important clue for determining the underlying cause. Sumo Logic’s outlier operator is designed to find anomalous spikes in numerical values. We can use this to determine when our 403 errors began occurring:
<pre><code class="nf">_sourceCategory</code><code class="o">=</code>s3_aws_logs <code class="o">AND</code> <code class="s">"InvalidAccessKeyID"</code><code class="o">|</code> <code class="k">timeslice </code>1m<code class="o">|</code> <code class="k">count as </code>access_key_errors <code class="k">by </code><code class="nf">_timeslice</code><code class="o">|</code> <code class="k">outlier </code>access_key_errors</pre>
Graphing the results as a line chart makes it ridiculously easy to identify when our web application broke:
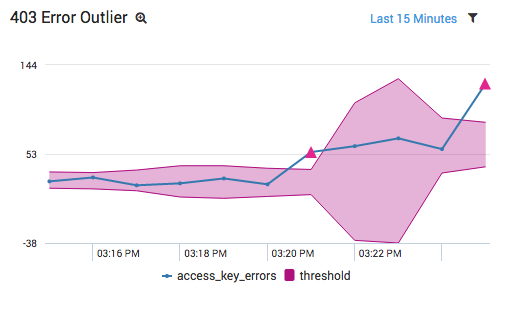
Without a centralized log management tool, it would have been much more difficult to identify when these errors began. You would have had to check multiple S3 buckets, grep for InvalidAccessKeyID, and find the earliest timestamp amongst all your buckets. In addition, if you have other InvalidAccessKeyID errors, it would be difficult to determine when the spike occurred vs. when a programmer mistyped some credentials during development. Isolating the time frame like this using traditional troubleshooting methods could take hours.
The point to take away is that log data lets you narrow down the potential root causes of a problem in many ways, and outlier lets you quickly identify important changes in your production environment.
Find Related Events in CloudTrail
Now that we have a specific time frame, we can continue our search by examining CloudTrail logs. CloudTrail records the administration activity for all of your AWS services, which makes it a great place to look for configuration problems. By collecting CloudTrail logs, we can ask questions like, “Who shut down this EC2 instance?” and “What did this administrator do the last time they logged in?”
In our case, we want to know what events led up to our 403 errors. All we need to do is narrow the time frame to the one identified in the previous section and pull out the CloudTrail logs:
<pre><code class="nf">_sourceCategory</code><code class="o">=</code>CloudTrail</pre>

The results show us that an UpdateAccessKey event occurred right when our 403 errors began. Investigating this log line further tells us that a user came in and invalidated the IAM access key for another user.
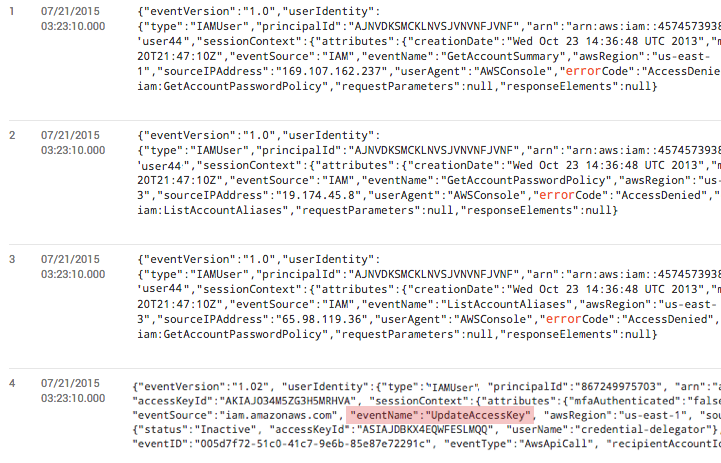
The log message also includes the username that performed this action, and we see it is the same username that assigns temporary S3 access keys to our web app users when they start a new session (as per AWS best practices). So, we now have the “who.” This is almost all of the information we need to solve our problem.
Note that if you didn’t know this was a security-related error (and thus didn’t know to check CloudTrail logs), you could perform a generic * | summarize query to identify other related errors/activity during the same time frame.
Stalk the Suspicious User
At this point, we have two possibilities to consider:
- One of your developers changed some security credentials but forgot to update the application code to use the new keys.
- A malicious user gained access to your AWS account and is attacking your website.
Once again, we can answer this question with log analytics. First, we want to take a look at what other activity this user has been up to. The following query extracts all the CloudTrail events associated with this user:
_sourceCategory="cloudtrail_aws_logs"|json auto keys"useridentity.type"|where%"useridentity.type"="suspicious-user"
Of course, you would want to change “suspicious-user” to the username you identified in the previous step. We find a long list of UpdateAccessKey events similar to the one above. This is looking like a malicious user that gained access to the account we use to assign temporary keys to users, but to really make sure, let’s check the location of the IP address:
_sourceCategory="cloudtrail_aws_logs"|json auto keys"useridentity.type","sourceIPAddress"|where%"useridentity.type"="suspicious-user"|lookuplatitude,longitude|count bylatitude,longitude|sort_count
The lookup operator gets the latitude and longitude coordinates of the user’s IP address, which we can display on a map:
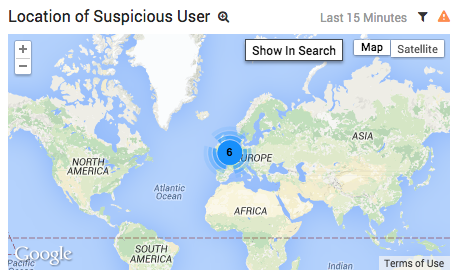
Our user logged in from Europe, while all of our existing administrators, as well as the servers that use those credentials, are located in the United States. This is a pretty clear indicator that we’re dealing with a malicious user.
Revoke Their Privileges, Update Your App
To resolve the problem, all you have to do is revoke the suspicious user’s privileges, change your AWS account passwords, and create a new IAM user for assigning temporary S3 access keys. The only update you have to make to your source code is to insert the new IAM credentials.
After you’ve done this, you should be able to verify that the solution worked by examining our graph of 403 errors. If they disappear, we can rest easy knowing that we did, in fact, solve our problem:
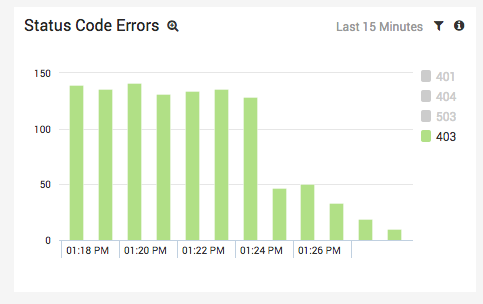
Debugging with log analytics means that you don’t need to touch your source code until you already have a solution to your problem, and it also means you can immediately verify if it’s the correct solution. This is an important distinction from traditional debugging. Instead of grep’ing log files, patching code, and running a suite of automated/QA testing, we knew exactly what code we needed to change before we changed it.
Conclusion
This article stepped through a basic AWS log analytics scenario. First we figured out what kind of error we had by examining S3 logs, then we figured out when they started by using outlier, determined who caused the problem with CloudTrail logs, and figured out why the user caused the problem. And, we did all of this without touching a single line of source code.
This is the power of centralized log analytics. Consider all of the SSH’ing and grep’ing you would have to do to solve this problem—even with only a single EC2 instance and S3 bucket. With a centralized log manager, we only had to run 7 simple queries. Also consider the fact that our debugging process wouldn’t have changed at all if we had a hundred or even a thousand EC2 instances to investigate. Examining that many servers with traditional means is nearly impossible. Again, if you want a scalable web application, you need scalable debugging tools.
We mostly talked about troubleshooting in this article, but there’s also another key aspect to AWS log analytics: monitoring. We can actually save every query we performed in this article into a real-time dashboard or alert to make sure this problem never happens again. Dashboards and alerts mean you can be proactive about identifying these kinds of issues before your customers even notice them. For instance, if we had set up a real-time alert looking for spikes in 403 errors, we would have been notified by our log management system instead of an unhappy user.
The next article in this series will talk more about the monitoring aspects of AWS log analytics. We’ll learn how to define custom dashboards that contain key performance indicators that are tailored to your individual web application. We’ll also see how this proactive monitoring becomes even more important as you add more components to your web stack.
Complete visibility for DevSecOps
Reduce downtime and move from reactive to proactive monitoring.

