In a previous post in this series, I wrote about how you can upload your log data to the Sumo Logic Service. In this second and final post in the series, I am going to discuss how you can extract important pieces of information and gain insight from your log messages. For additional technical details on any of the sections below, please see the online help.
Step 2 – Extract
After some initial exploration of your logs, you can now extract fields that represent important information for further analysis.
For simplicity, let’s assume your web application writes log messages in a format that allows for readability and parsability much like the Apache error log:
[<Timestamp>] [level: <log level>] [client: <IP address>] <reason>
When defining the Source, you can configure the timestamp in log messages to be parsed out automatically or you can ignore all timestamps in a message, in which case the time of receipt by the Sumo Logic Service will be used. In either case, you do not need to explicitly extract timestamps yourself.
For the other pieces of information in your log message such as log level, client IP address and reason, you can write specific search terms to extract their values. At this point, you should refer to the Getting Started with Search section in the online help to understand the Sumo Logic search syntax.
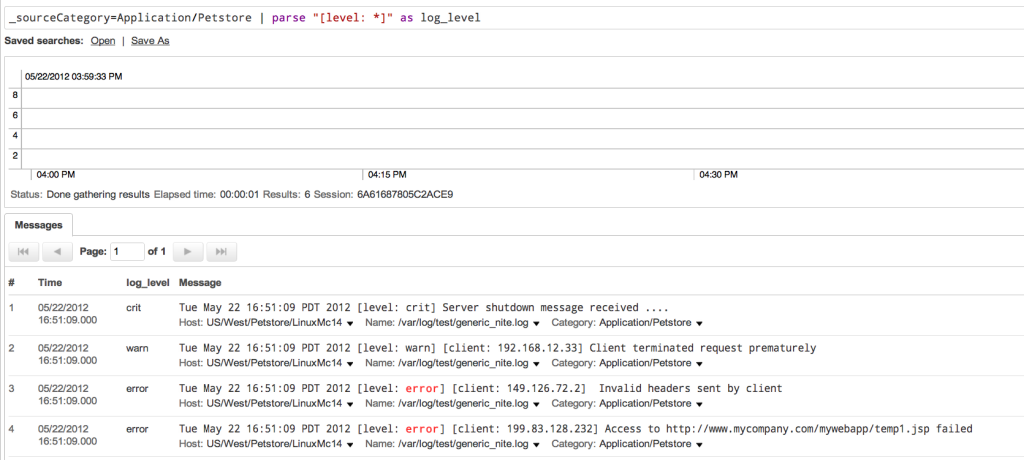
To parse out the log level using the parse operator, you can write the following search term in the Sumo Logic web application:
_sourceCategory=Application/Petstore | parse “[level: *]” as log_level
When you run this search, in addition to seeing the actual log message, you will also see a new field called “log_level” that will display the log level for every message as shown below.
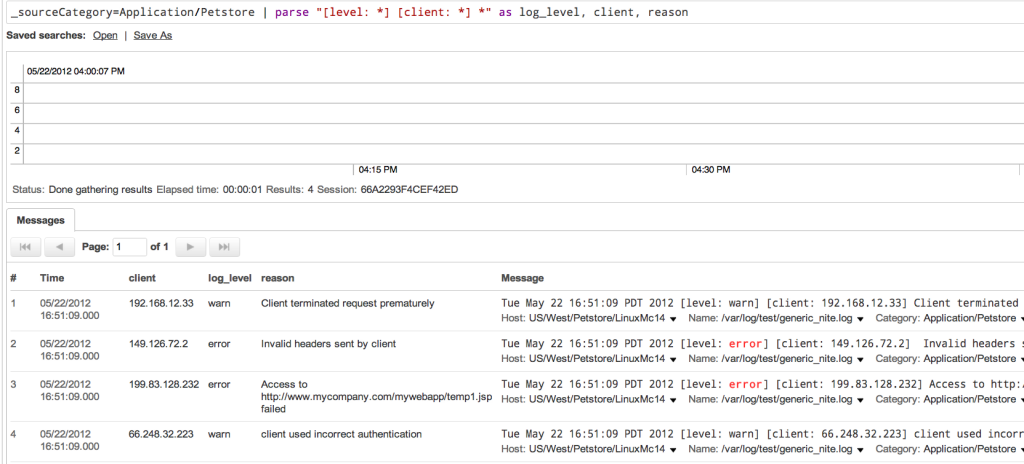
To parse all three fields you could use the following search term:
_sourceCategory=Application/Petstore | parse “[level: *] [client: *] *” as log_level, client, reason
With this search term, you will get three new fields as shown below:
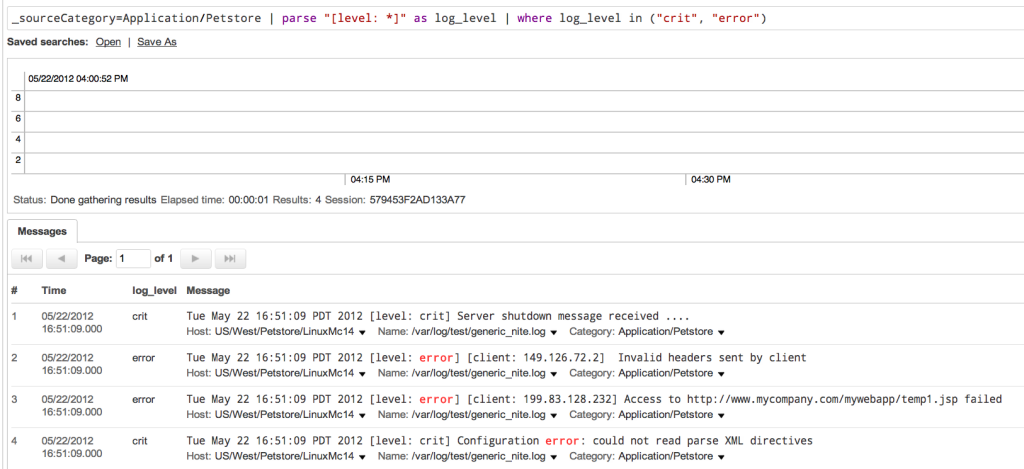
At this point, you may want to select only those messages which are critical or that identify errors; in which case you would write a search term using the where operator like this:
_sourceCategory=Application/Petstore | parse “[level: *]” as log_level
| where log_level in (“crit”, “error”)
This search will return only those messages with the “crit” and “error” log levels as shown below:
The search syntax does allow for more complex parse expressions such as regular expressions. See the Searching Your Data section in the online help for further details. Sumo Logic has also parser libraries for common log types such as the Apache web server. See the Automatically Extracting Fields with Parsers section in the online help on how to use them.
At some point, you may want to save the search you just wrote, since you will most likely be using it repeatedly to find certain kinds of messages. You may also want to schedule it to run periodically and email you the results only if the number of messages are more than a certain amount across a given time interval. For example, you may want to schedule a search to return only if there are more than 20 critical or error messages in an hour. See the Saving a Search Query and the Scheduling a Search sections in the online help for instructions on how to do this.
Step 3 – Analyze
So now that you know how to extract information from log messages and get only those messages that you want; the next step is to get more insight into what your logs are telling you.
To begin with, you may want to get a list of the top client IP addresses causing errors over the past day; in which case you would write a search term using the count and top operators like this: :
_sourceCategory=Application/Petstore | parse “[level: *] [client: *] *” as log_level, client, reason | where log_level=“error” | count by client | top 10 client by _count
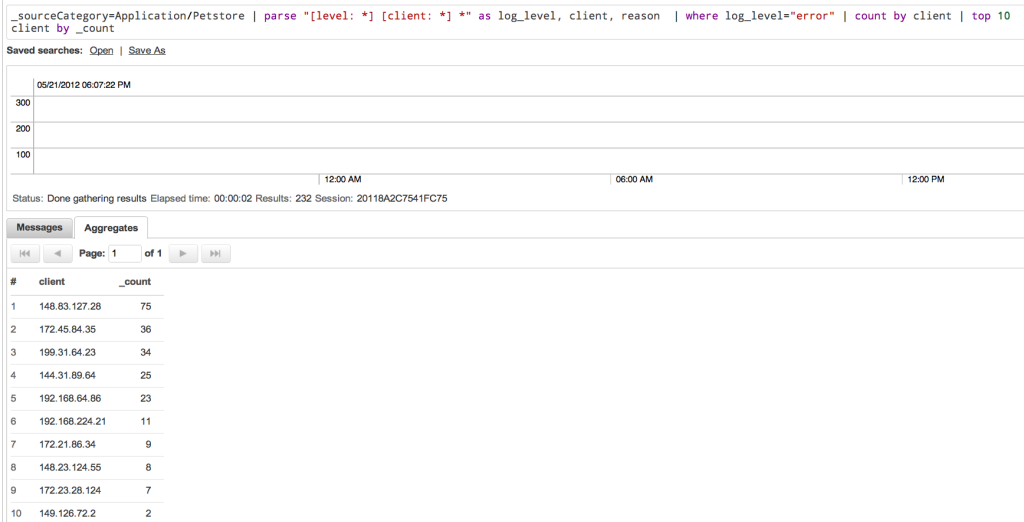
Given these results, you may want to investigate why some of these IP addresses are causing so many errors and what can be done to prevent them from happening again.
Now, you may want to use the summarize operator to get an overview of all your log messages. To do this you could use the following search term:
_sourceCategory=Application/Petstore | summarize
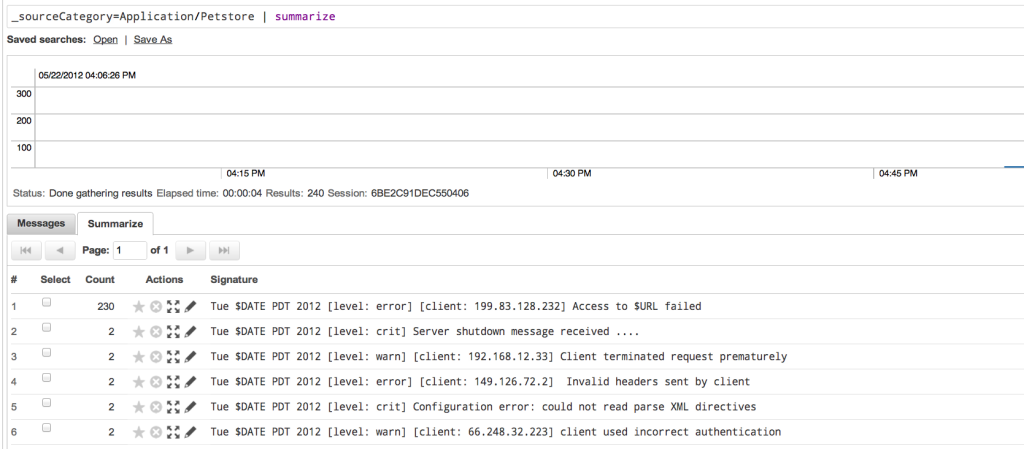
As you can see, messages with similar keywords and structures are grouped into clusters and in the first cluster, the URLs in 230 log messages were automatically reduced to $URL so that you can focus more on what the actual message is.
You can drill-down to the individual log messages simply by selecting any of the clusters and clicking the “View Details” button to see the actual messages. For instance, in this case you may feel that the number of “Access to $URL failed” type messages are unusually high and may warrant further investigation.
For more details on the various capabilities of our search syntax, see the Search Syntax Overview sections in the online help.
Summary
I hope this series has given you a good idea of how to start collecting and gaining insights from your log data using Sumo Logic. If you have any further questions feel free to contact us.

